PyQGIS, QML and charts
 July 30, 2019
 QGIS, Python, QML, Charts
![]() Paul Blottiere
Paul Blottiere
Introduction
A recurring question when developing a QGIS Python Plugin is the kind of existing tools or libraries to plot a graph, and there is no single solution yet.
The most common solution is the famous matplotlib library and there are many examples available online. Indeed, it’s a robust solution with a huge amount of documentation.
Another very interesting solution is the Plotly library, which allows to make high quality graphs with an emphasis on interactivity. By the way, DataPlotly is an awesome QGIS plugin written by Matteo Ghetta which uses Plotly and allows to explore your data thanks to numerous plot types.
A third solution is Pygal, a simple but still efficient Python library allowing to draw and export SVG graphics. Interactivity is limited, but still sufficient for numerous cases. For example, graffiti uses this library to generate statistics reports on QGIS Server performances.
A clear disadvantage of this non-exhaustive list of solutions is the need of an external library, requiring the installation of a specific package. It’s not a big issue, but the ability to draw good quality charts without external dependencies within QGIS is still a real question. By the way, a QEP is currently in progress on this subject. On this occasion, Hugo Mercier recently brought up the possibility to directly use the QGIS core symbology to plot charts, just like what was done for the QGeoloGIS plugin.
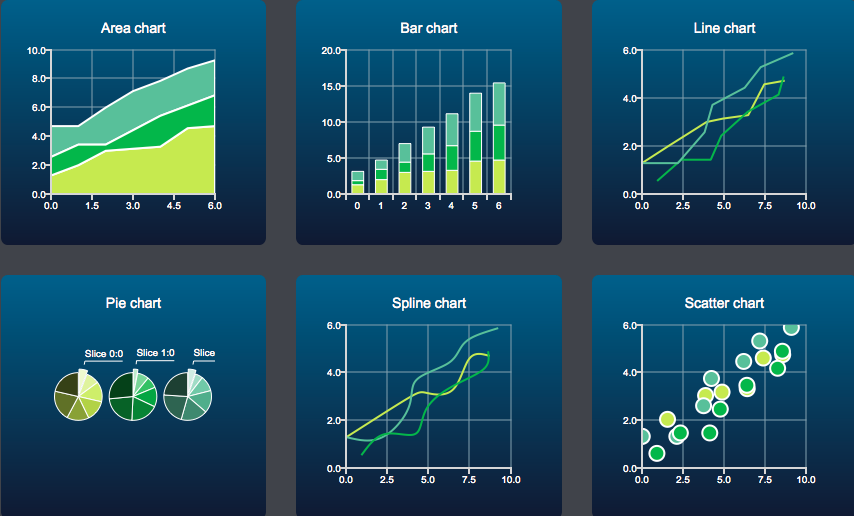
But in this article, we’ll take a look to a completely different solution: the Qt QML module. Actually, this module provides a dedicated API to design and display many different kinds of chart types. Not only this solution allows to plot high quality graphs with a compelling interactivity, but it’s directly distributed with Qt.
Since QGIS 3.4, QML may be used to subtly configure your widget thanks to David Signer. But from now on, we’re going to focus on ways to use the QML chart API in QGIS Python plugins. Source code provided in this article is available on github through a plug-and-play script and can been tested in the code editor embedded with QGIS.
Source code has been tested on GNU/Linux (Archlinux) with QGIS master and on
Windows 10 with QGIS 3.8. On Windows, QGIS was installed with the standalone
installer and no additional packages was needed to use the QML API. On
Archlinux, I had to install the qt5-charts package.
QML loading
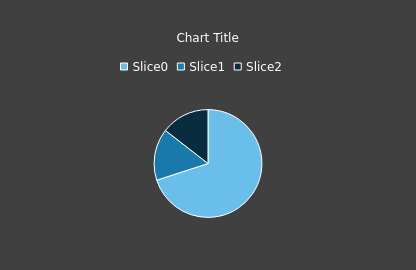
Our first goal is to display a simple pie chart. To do that, we create a QML
file pie.qml with a ChartView containing a
PieSeries with some slices. The chart is slightly customized
(title, background color, …) but much more can be done.
pie.qml
import QtCharts 2.0
import QtQuick 2.0

ChartView {
  antialiasing: true
  title: "Chart Title"
  titleColor: "white"
  backgroundColor: "#404040"
  legend.labelColor: "white"

  PieSeries {
    PieSlice { label: "Slice0"; value: 70.0 }
    PieSlice { label: "Slice1"; value: 15.5 }
    PieSlice { label: "Slice2"; value: 14.5 }
  }
}
Thus, we can use the QQuickView Python class with the
setSource() method to effectively load the QML file.
main.py
from qgis.PyQt.QtCore import QUrl
from PyQt5.QtQuick import QQuickView

qml = "/tmp/pie.qml"

view = QQuickView()
view.setResizeMode(QQuickView.SizeRootObjectToView)
view.setColor(QColor("#404040"))
view.setSource(QUrl.fromLocalFile(qml))

if view.status() == QQuickView.Error:
    for error in view.errors():
        QgsMessageLog.logMessage(error.description())
else:
    view.show()
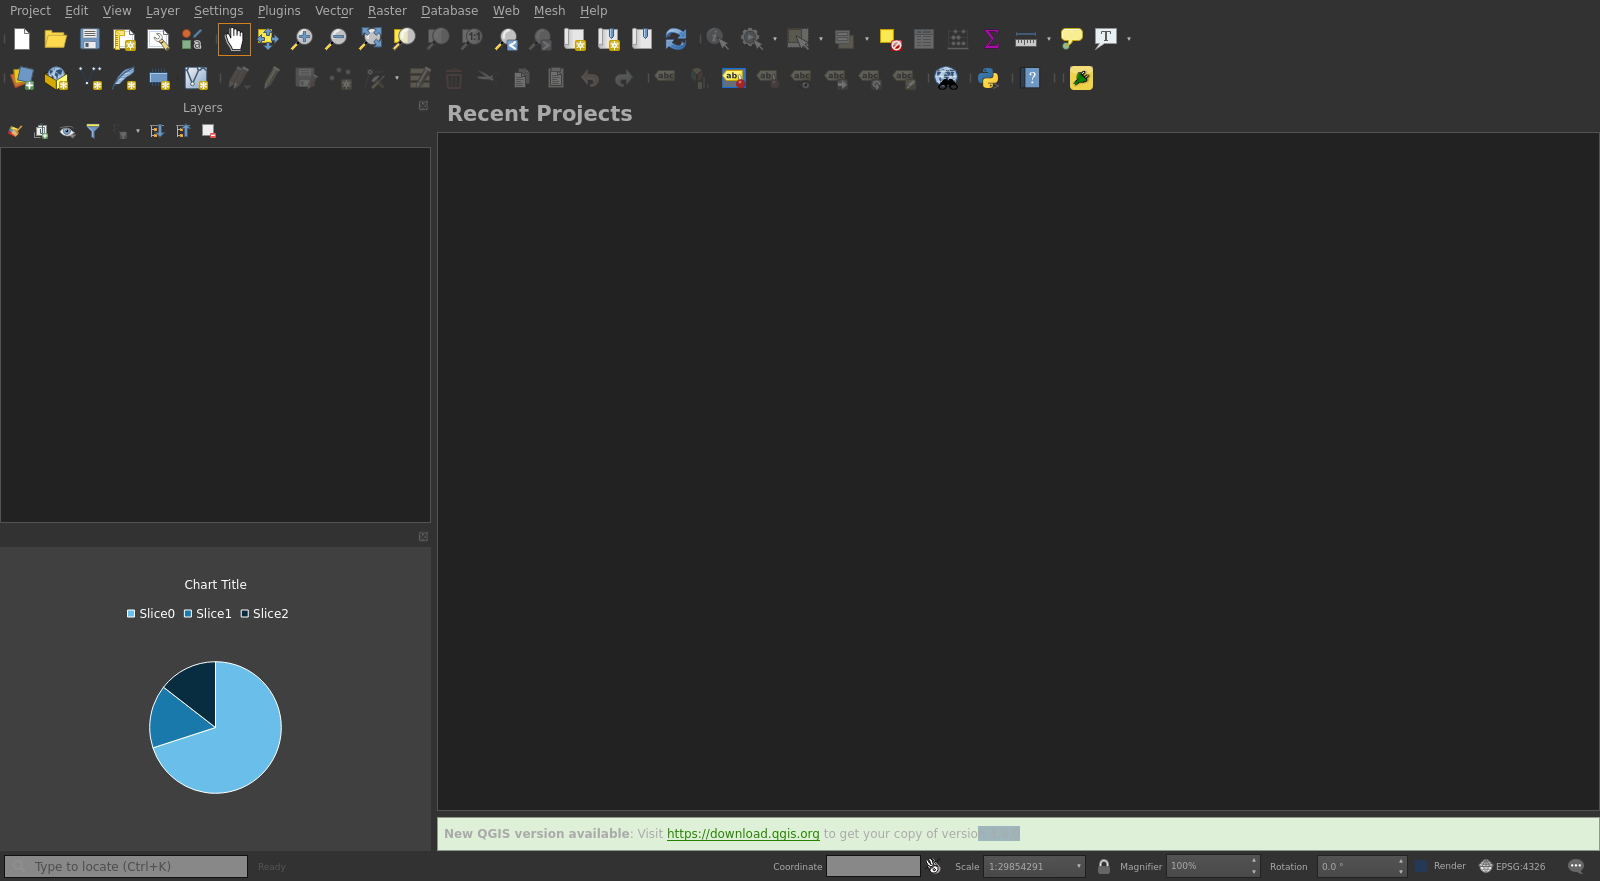
A dedicated window is displayed after calling show() because
QChartView inherrits from QWindow. So, we have to
create a container to embed a window into a QWidget if we want to
display the chart within another widget. It can be done thanks to
QWidget::createWindowContainer() static method. And in doing this,
we are able to add the chart view within a QGIS dock widget.
main.py
from qgis.PyQt.QtWidgets import QWidget, QDockWidget
from qgis.PyQt.QtCore import Qt

# view.show()
container = QWidget.createWindowContainer(view)

widget = QDockWidget()
widget.setWidget(container)
widget.setMinimumHeight(300)

iface.addDockWidget(Qt.LeftDockWidgetArea, widget)
Configure QML items from Python
In the above example, slices of the pie chart are configured in the QML file, but now, we want to customize the item from a Python script. There are several ways of doing that, but the easiest solution is to use QML properties.
pie.qml
import QtCharts 2.0
import QtQuick 2.0

ChartView {
  title: pypie.title

  PieSeries {
    id: pieChartId
  }

  Component.onCompleted: {
    addSlices()
  }

  function addSlices() {
    var slices = pypie.slices
    for (var name in slices) {
      pieChartId.append(name, slices[name])
    }
  }
}
The Component.onCompleted() handler is called once the QML object
is instantiated. So we use the addSlices() QML function to
retrieve slices from Python thanks to the pypie.slices. Actually,
the pypie variable is a QObject coming from Python. The
same object is used to define the chart title. We may note that the
PieSeries id is used to add slices in the chart with the
pieChartId.append() method.
Now, let’s define the Python class inheriting from QObject to be
used as the pypie property:
pie.py
class PyPie(QObject):

    titleUpdated = QtCore.pyqtSignal(str)

    def __init__(self):
      super().__init__()
      self._title = "Chart Title"
      self._slices = { "Slice0": 70.0, "Slice1": 15.5, "Slice2": 14.5}

    @QtCore.pyqtProperty(str, notify=titleUpdated)
    def title(self):
        return self._title

    @title.setter
    def title(self, title):
        if self._title != title:
            self._title = title
            self.titleUpdated.emit(self._title)

    @QtCore.pyqtProperty('QVariantMap')
    def slices(self):
        return self._slices
The PyPie class specifies in particular the title
property thanks to the decorator pyqtProperty. It allows the QML item
to retrieve the title thanks to pypie.title. An interesting thing to note is
the notify parameter used in this decorator. Actually, it means that
as soon as the signal titleUpdated is emitted, the property of the
QML item will be automatically updated. In the same way, the slices
method is also defined as a property.
Finally, the last necessary step is to “link” the pypie property
with a PyPie instance. To do that, we just have to use the
setContextProperty() method on the view’s context.
main.py
qml = "/tmp/pie.qml"

pypie = PyPie()

view = QQuickView()
view.setResizeMode(QQuickView.SizeRootObjectToView)
view.rootContext().setContextProperty("pypie", pypie)
view.setSource(QUrl.fromLocalFile(qml))
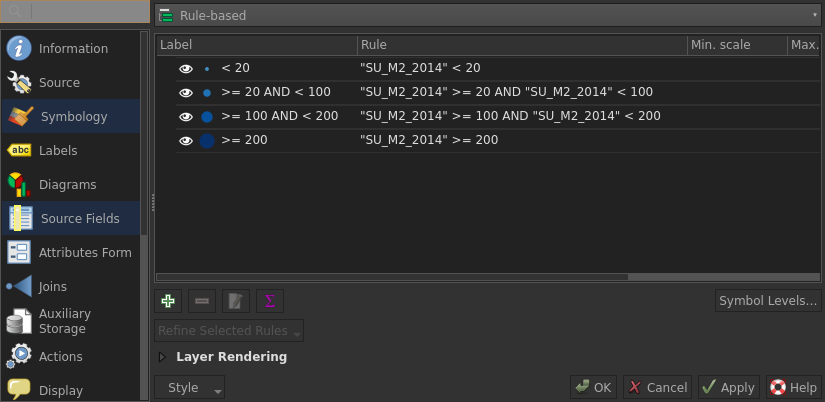
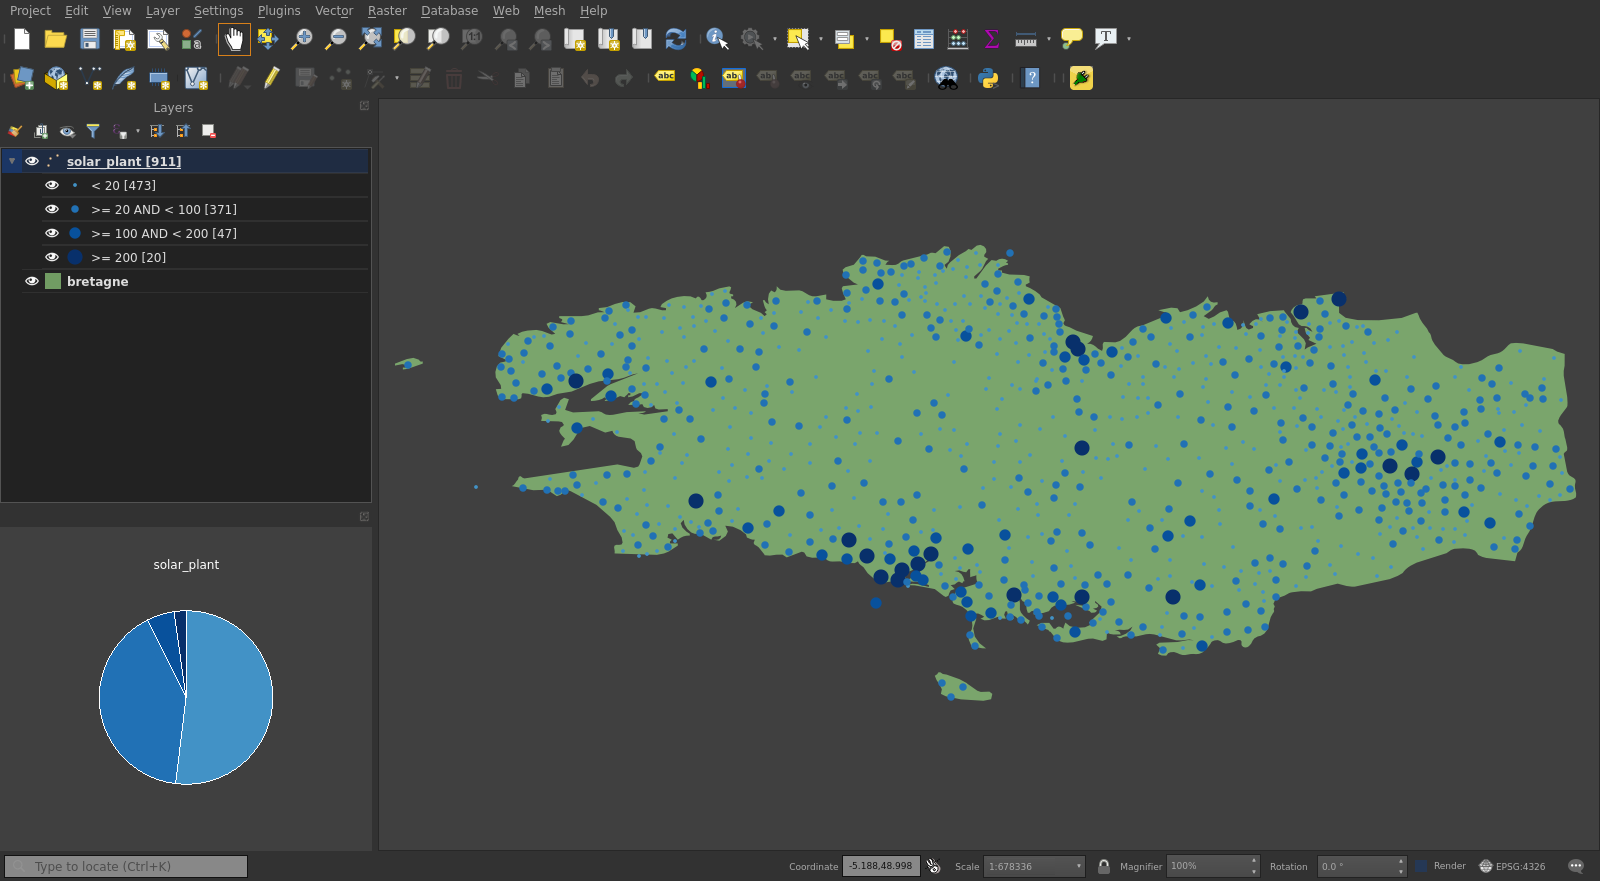
Pie chart and rule-based renderer
For a more concrete example, we consider a vector layer based on
Open Data
where the SU_M2_2014 field, indicating the solar installation
surface by municipality in Brittany, is used to define a Rule based renderer
where symbols are varying in color and size.
This way, if we want to display a pie chart based on the number of features for each
rule with the corresponding color, we have to implement a method to build
slices from the renderer settings as well as adding a labelColor()
method to retrieve rule’s color from a specific label.
pie.py
class PyPie(QObject):

    def __init__(self):
      super().__init__()
      self._title = "Chart Title"
      self.initSlices()

    def initSlices(self):
        slices = {}
        layer = iface.activeLayer()
        total_count = layer.featureCount()

        renderer = layer.renderer()
        for item in renderer.legendSymbolItems():
            if not renderer.legendSymbolItemChecked(item.ruleKey()):
                continue

            count = layer.featureCount(item.ruleKey())
            slices[item.label()] = count * 100 / total_count

        self._slices = slices

    @QtCore.pyqtSlot(str, result='QColor')
    def labelColor(self, label):
        renderer = iface.activeLayer().renderer()

        for item in renderer.legendSymbolItems():
            if item.label() != label:
                continue

            return item.symbol().color()

        return QColor()

    @QtCore.pyqtProperty('QVariantMap')
    def slices(self):
        return self._slices
Then, the addSlices() QML function is updated and a new
sortValues() function is introduced to sort slices by value in the
chart.
pie.qml
function sortValues(obj)
{
  var array=[]

  for(var key in obj) {
    if(obj.hasOwnProperty(key)) {
      array.push([key, obj[key]])
    }
  }

  array.sort(function(a, b) {
    return b[1]-a[1]
  })

  var dict = {}
  for ( var index in array ) {
    const item = array[index]
    dict[item[0]] = item[1]
  }

  return dict
}

function addSlices() {
  pieChartId.clear()
  const slices = sortValues(pypie.slices)

  for (var name in slices) {
    var slice = pieChartId.append(name, slices[name])
    slice.color = pypie.labelColor(name)
  }
}
Notify events from Python to QML items
The disadvantage of the previous method is that the pie chart is not dynamic,
because it does not reflect changes of the vector layer (title, symbology,
…). To do that, we have to introduce a Connections QML element
which is able to react on a signal emitted by a Python object.
In our case, the aim is to keep the pie chart up to date according to the
current visibility of rules. So, the first step is to detect when a user
modifies a rule’s visibility in order to update slices and emit a signal
updated.
pie.py
class PyPie(QObject):

    updated = QtCore.pyqtSignal()

    def __init__(self):
        super().__init__()
        self._slices = {}
        self.initSlices()

        iface.activeLayer().styleChanged.connect(self.update)

    def update(self):
        self.initSlices()
        self.updated.emit()

    ...
On QML side, the Connections element just need to define the
onUpdated signal handler to reset slices.
pie.qml
Connections {
  target: pypie
  onUpdated: {
    addSlices()
  }
}
Catch events from QML items
In the previous part, we saw how to use the Connection QML element
to execute QML function when a Python signal is emitted, but the reverse is
also possible.
In our case, the pie chart defines some signal handlers like
onHovered or onClicked. This way, it’s easy to
call a Python method when an action is directly realised on the chart.
pie.qml
PieSeries {
  id: pieChartId

  onClicked: {
      for ( var i = 0; i < count; i++ ) {
          at(i).exploded = false
      }
      slice.exploded = true
      pypie.select(slice.label)
  }
}
Selecting features when a slice is clicked is pretty simple then.
pie.py
@QtCore.pyqtSlot(str)
def select(self, label):
    layer = iface.activeLayer()
    renderer = layer.renderer()

    for item in renderer.legendSymbolItems():
        if item.label() != label:
            continue

        rule = renderer.rootRule().findRuleByKey(item.ruleKey())
        expr = rule.filterExpression()

        fids = []
        for feature in layer.getFeatures(expr):
            fids.append(feature.id())

        layer.selectByIds(fids)

Conclusion
To conclude we can say that the QML API to draw charts is clearly a solution which should not be neglected when developing a Plugin for QGIS 3. Indeed it’s:
- simple to implement once we have understood basic concepts
- distributed with Qt so we don’t need an additional package
- beautiful with a good interactivity
As a matter of interest, a self-sufficient pyqgis
script
is available on github to draw pie charts for any vector layer using a rule-based renderer.